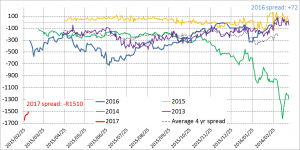
Below is a line graph portraying the spread between July white maize over March white maize for the current year 2016, the previous 3 years as well as next year’s spread 2017 and the average of the most recent 4years. Should a closer eye be kept on the 2017 spread as JUL17WMAZ trades R1510 below its MAR17WMAZ counterpart as shown by the red solid line in the graph below?…
Mar17/Jul17 WM Spread
on 3 March , 2016
with No Comments


