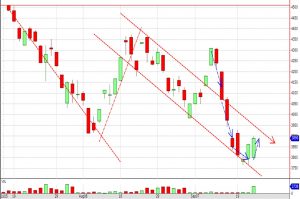
 Below is a daily candle stick chart portraying the trade action for the DEC16WMAZ contract over the past 2 months. Trade has slipped sharply back into the downtrend after which it bounced on lower support and currently has made 3 higher green bars as shown in the graph below. With parities fairly UNCH this morning, with a weaker Rand neutralized by lower Chicago corn prices, we could see trade reaction either up or down. Trend support is seen somewhere around R3730 whilst trend resistance is seen somewhere around R3930
Dec16WM Graph
on 5 October , 2016
with No Comments


