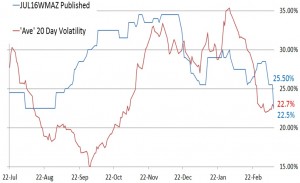
The line chart below shows the published volatility and ‘average’ 20-day volatility (average between: underlying movement based on mark-to-market prices and the underlying movement based on the daily high and low prices.). Published volatility remained under some strong selling pressure last week, eventually dropping 2.5% on Friday from 25.5% to 22.5%. Intra-day volatility remains high, based on daily high/low prices, as we’ve seen an R80 or more intra-day move in 14 out of the last 20 sessions whilst the contract showed an R80 or move based on MTM prices only 6 out of the last 20 sessions. Could implied volatility decline more or would ‘vol’ speculators see current levels as relatively low and thus as an opportunity in a market with variable and uncertain conditions?
AVG 20 Days Vols Jul16Wm
on 14 March , 2016
with No Comments


